By raveswei
This document will try to research one of the most controversial housing issues in Australia – supply/demand issue. Many times we heard arguments that Australia is facing a chronic shortage or that price boom is not followed by supply response. At the same time, some people claim that we have oversupply of homes for decades. In this document we will try to estimate residential demand and supply in recent years. We will focus on demand/supply for dwellings used as primary residence. This is very complex issue because of many unknowns and limited data. We will try to make assumptions that will favour shortage argument. Data for Australian cities are not available so this document will focus on all of Australia.
Document will be organized in the following order: In a first few sections, we will go through the supply and demand calculations for one particular year (2007-08), showing the data sources and methodology. Later we will provide data for a period 1995-2010 calculated using the same data sources and methodology. At the end we will give a conclusion. All raw data used is provided by ABS or Department of Immigration.
DEMAND
Estimation of the demand for housing is not easy task. Demand is driven by many factors, but two of them are the most important: population growth and household demographics change. Population growth has two components: natural increase and net overseas migration.
Migration
Immigration is one of the most important drivers of the housing demand in Australia. Both immigration components (permanent and temporary), increase housing demand in the short term and should be included in calculations. In 2007-08 there was 277 000 net migrants (number of immigrants minus number of emigrants). There was 149 400 permanent arrivals and 76 900 permanent departures. Out of this number there was almost 38 400 “family immigrants” - large majority of them (80%) being partners and children. It is a reasonable to assume that these immigrants do not contribute to the new housing demand (do not create new households) in the first year after arrival. On longer run some of them will require new homes but that demand will be included in the demand calculation that uses households size changes.
Because of the similar demographics among permanent immigrants and emigrants we may assume that dwellings previously used by emigrants are adequate for the same number of immigrants. This assumption is based on similar age, similar proportion of children, occupation... This leaves only 38 400 permanent immigrants in need for a new home. After taking into account fact that around 15% of them are dependent children, assumption of household size of 2 persons is well on the safe side. In 2007-08 these immigrants created demand for 19 200 dwellings.
Net number of temporary, long term visitor, immigrants in 2007-08 was 205 200 with majority of them being foreign students and WHMs. Around 73% of all long term visitors (long term visitors include following groups: temporary workers, students and WHMs) 149 800 were students and WHMs, majority of them being students from China and India. This group of a temporary immigrants add less demand for new housing than the general immigration population. Some of WHMs stay in hostels and budget hotels, not adding any demand for residential housing. Estimation of foreign student and WHM demand for residential housing is not strait forward, but based on student living habits we think that assumption that average student household size of 2.5 is well on the safe side. There are many student living arrangements that involve 3, 4 or more students sharing the same dwelling. This created demand for 59 900 dwellings.The rest of temporary immigrants (55 400) are workers and their families. We will use household size of 2 to be on safe side. It is very likely that workers who arrived with families live in larger households. It is also likely that some of the single workers share dwelling with other single persons. They created demand for 27 700 dwellings.
References:
ABS 3412.0 Migration 1995-2008
- Department of Immigration and Citizenship – Migration Program Statistics http://www.immi.gov.au/media/statistics/statistical-info/visa-grants/migrant.htm
- Department of Immigration and Citizenship – Fact Sheet – Permanent Arrivals and Departures - http://www.immi.gov.au/media/fact-sheets/05emigration_1.htm
- Department of Immigration and Citizenship – Population flows: Immigration aspects 2000-2009
- Department of Immigration and Citizenship - Settler Arrivals 2001 – 2010
- Department of Immigration and Citizenship - Immigration in Brief 2000
Natural population increase
There was 289 500 births and 140 700 deaths in 2007-08. This makes natural population growth of 148 800. Births do not directly increase the demand for new dwellings, but they affect household size and distribution. The best way to estimate internal demand for new housing is to determine housing demands generated by demographic changes and natural population increase.
Unfortunately the number of households is available only for census years and the number of migrant households is not available at all. Instead we will use following formula:
This formula includes new housing demand from natural increase and demand from household demographic changes. Household size change includes all of previous population changes (including divorces, marriages, new household creation, previous migration …). Good way to estimate demand from household changes is to use household size number.
Household size change can be calculated using the closest two census data with assumption that change during short period between two censuses is linear.
It is interesting to notice that according to census based data, household size slightly increased between 2001 and 2006. For the years after 2006 we will use new ABS household projections (Series II) that projects household size shrinking in following decades. This numbers are very likely to be underestimated because two previous ABS projections were wrong (ie. in 2001 ABS projected household size to shrink to 2.5 in 2006, instead household size increased by 0.01).
In year 2007-2008 there was 21 432 000 Australian residents, the projected household size of 2.62 and projected household size change of -0.38%. This data gives additional demand from natural increase of population was 56 800. Demand generated by household shrinking in 2007-08 was 33 600. Combined internal demand for new dwellings was 90 400.
Total demand for additional dwellings in 2007-2008 was 198 900. Please notice that this number is much larger that estimates provided by other people who use population increase divided by average household size (163 000).
References:
- ABS 3236.0 Household and Family Projections (1996-2001-2006)
- ABS 1301.0 Year Book Australia 1995-2010
- ABS 3222.0 - Population Projections, Australia, 2006 to 2101
- ABS Census Data (1996-2001-2006)
SUPPLY
There are two components of a housing supply. The first and the obvious one, is new dwelling construction supply. Second component of housing supply is made of vacant dwellings after resident’s death. In this section we will try to estimate these numbers.
New Construction
For the new construction supply we will use ABS Number of dwelling units Commenced. This number is slightly lower than Number of New dwelling units Approval, what put us on the safer side because not all aproved units are built.
In 2007-2008 there were 158 500 new unit commencements. To get more realistic number of the new residential dwelling supply we have to subtract number of dwellings that were demolished or replaced during the same period. To estimate this number we will use available data from Queensland. During 5 year period (2001-2006) around 1% of housing stock in Brisbane LGA was replaced or demolished. The same report estimates replacement levels of 0.5% in Gold Coast City, 0.25% in other urban LGAs, and 0.1% in the rest of Queensland. To be well on the safe side we will use 1% replacement level over 5 year period for whole Australia. This estimate is likely to be well above the real number because not all of the new construction is done in central LGAs. Using the estimate that housing stock was 1.06 times higher than number of households we got 17 300 demolished or replaced dwellings in 2007-08.
The total number of newly constructed residential dwellings in 2007-08 was 141 200. Some of these homes were holiday homes not available for new residents, so we have to subtract holiday homes from the total number. We will use generous estimate that around 4% of all new dwellings are holiday homes. That makes 5650 of new dwellings holiday homes. So the total number of new dwellings available for primary residence in 2007-08 was 135 500.
References:
- ABS 8750.0 - Dwelling Unit Commencements
- Queensland Department of Local Government, Planning, Sport and Recreation - Household projections, Queensland Local Government Areas 2007- Appendix A
Other Supply
Single person households create housing supply after the resident dies. In this section we will try to estimate number of dwellings made vacant after resident death.
Huge majority of Australians who die are old persons, 80% of persons who died in 2008 were 65+ at the time of death. There were around 140 700 deaths in that year. According to ABS data, in 1996 38% of population 65+ were living alone. This number is projected to increase by 84% in next 25 years. This gives us 50.5% of 65+ people living alone in 2007-2008; to be safely on the conservative side we will use 5% lower estimate - 45.5%. There are also some living alone persons under age of 65 who died but to be on the safe side we will not include them in our calculation.
After taking into account all this we may say that more than 51 000 dwellings are made available by the resident death in 2007-08. This number significantly adds to the supply side and it is often neglected by other authors. Combined, new construction supply and supply from homes vacant after the resident death makes total supply in 2007-08 of 186 500 homes available for new residents.
References:
- ABS 3302.0 – Deaths 1995-2010
- ABS 1301.0 Year Book Australia 1995-2010
- ABS 3236.0 Household and Family Projections (1996-2021, 2001-2026)
TRENDS
In this section we present results that we calculated using the same methodology we used for year 2007-2008. Some data (household size) between censuses is estimated using linear progression. This is likely to be a good estimate because of the nature of data set and short period between two censuses. Table 1 shows estimated demand and supply for period between year 1994-1995 and 2009-2010.

Table 1. Supply and Demand for residential dwellings in Australia
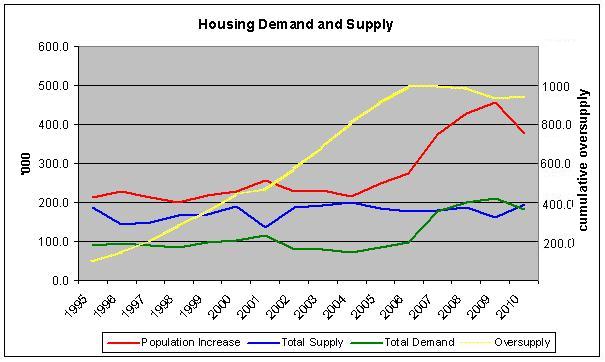

Chart 1. Supply and Demand for residential dwellings in Australia
CONCLUSION
By looking at the results we may see that Australia is facing huge oversupply of residential dwellings. Since 1995, there were only two years of a construction undersupply (2008 and 2009) driven by huge immigration numbers. During the years before that, Australia was building the similar number of new homes while immigration and population increase was half or even third of the 2008 or 2009 levels. After 15 years of construction, almost 950 000 dwellings that now do not have primary resident were built. That is around 10% of total housing stock. This means that around 38% of newly constructed dwellings during this period were oversupply (not used as primary resident or holiday home).
It may look very strange that such a huge oversupply is not easily visible. The reason for this, in our opinion, is the fact that market demand for housing was huge and in large part driven by investors interested in capital gain. Similar market behaviour was recorded in some parts of USA and Europe recently. In all these places, during the period before market crush, many reports were warning of a housing shortage, just to discover huge real oversupply after bubble bursted.
This is an estimated number, intentionally biased toward the undersupply side and as such, it is good enough to shows that there is significant real oversupply of homes in Australia. Situation in a particular city may be slightly different but after taking into account that combined capital city population did not grow faster than general population we may say that estimates are good for most of the cities. Some of capital cities (Sydney, Hobart, and Adelaide) had slower that the average population growth. Same cities also recorded lower construction activity and slightly larger mortality rates among older population. In addition, Sydney and Melbourne population increase was mostly driven by student population that demands less housing than natural increase or other immigrants. Some of the areas with high construction activity (Gold Coast, SE and North Queensland, Mandurah) were also fastest population growing areas in Australia.
Huge real (primary residence) oversupply will significantly impact house prices in Australia in future. In the case of market slowdown, oversupply will flood the market driving prices down.
Calculation table:
table.pdf
Calculation table:
table.pdf
Hi Raveswei,
ReplyDeleteHave you considered including the total number of properties that became unavailable within the same period? (e.g. properties that were demolished to make room for the new establishment or properties that became unsuitable for habitation)?
Given your focus on primary residence, how did you segregate between new primary residence constructed and new dwellings for investment purpose (e.g. students accommodation, service apartments, mixed purpose apartments, etc)
Good job, btw
Cheers,
Kenny
If you read my post again, you may notice that I subtracted demolished homes from the number of new dwellings. I used data from Brisbane LGA stating that 1% of total housing stock gets demolished in 5 year period. This percentage is substantially lower in less urban LGAs, but to be on the safe side I used this highest demolition rate for all Australia. Depending on the construction numbers in a particular year, 10-12% of new dwellings are not counted in the supply for this reason (see linked table).
ReplyDeleteI also subtracted a number of holiday homes from new dwellings. I used estimate that 4% of all new dwelling are built as holiday homes and should not be counted toward supply of residential homes for this purpose.
It is irrelevant whether property is built for investment or owner-occupier purposes as long as it is built to provide primary residence for a household.
I included all residential properties in the supply count because I included all people in the demand count. I'm not sure what kind of student accommodation and service apartments you are referring but if it’s built for an accommodation business purposes, it is not counted in the ABS new residential dwellings stats, instead it is counted toward commercial units (same as hotels, resorts …).
If you are talking about ordinary units rented to students, than I don't see a reason why it should not be included. If you want to exclude this kind of student or worker accommodation, than we should also exclude students and temporary workers from the demand.
To sum up, I included all students and temporary workers in the demand even though some of them are living in hostel / service apartment properties that are not counted toward new built dwellings. In my opinion this just puts me more on the demand side making final numbers likely to be smaller than actual.
Beyond properties that were demolished, the supply should take into consideration of property that became unsuitable for habitation.
ReplyDeletehttp://www.nhsc.org.au/state_of_supply/2008_ssr_rpt/chap2.htm#t8
"An increase in the number of households may imply the need for an equivalent increase in the number of dwelling completions, although the gross increase needed in housing completions will be larger due to the need to also replace dwellings that have been demolished or are no longer suitable for habitation"
For example, natural disasters (Flood, Cyclone, Bush fires) left hundreds of thousands of properties uninhabitable over the relevant period. A portion of the properties are never rebuilt. I don't know the significance of these properties and its implication. But I appreciate the difficulty in obtaining the info on this matter.
I am satisfied with your response re dwelling for investment purpose.
Thanks
You are right that there are some properties that are vacant and not suitable for living. The real question is why they are empty and ruined and should they be counted in the supply.
ReplyDeleteI really question the statement "natural disasters (Flood, Cyclone, Bush fires) left hundreds of thousands of properties uninhabitable over the relevant period". It sounds much exaggerated.
Since 1995 when my data series started, there were few disasters with not more than a few tens of thousands affected homes (including the latest floods) and huge majority of those homes just slightly damaged and quickly repaired soon after. These numbers are not available but my guess would be that there were maybe few thousands homes that were severely damaged and never repaired or rebuild. That number (even if double or triple as high) really does not affects final numbers and conclusion much.
Most of these properties that never get repaired are in rural areas so my generous assumption of 1% replacement rate for all areas, including rural, takes care of most of these homes.
On the other hand, it is true that there are many empty houses in bad condition around Australia, but those are likely to be result of oversupply (nobody needs them) than a consequence of a disaster. Under the shortage conditions every home would be fixed to be adequate for living. None of these homes would exist and they will all be crowded with people.
Most of those homes require just a fraction of the time and cost of a new home development to be repaired, they do not require new land development, complicated paperwork ... They are most likely to empty and abandoned because they are not needed – there is no people who need them for a residence. Because of all these reasons, I think, they should be counted toward the supply.
Hi there, awesome site. I thought the topics you posted on were very interesting. I tried to add your RSS to my feed reader
ReplyDeleteand it a few. take a look at it, hopefully I can add you and follow.
Australian Immigration Agents
Great post! The housing market in Australia is just a little too shaky for me right now, so I've been looking at apartments in Melbourne...maybe if things calm down I would be interested in buying but for now an apartment will work.
ReplyDeleteCorrupt stinking Government, a nation of uneducated greedy bogans, greed and more greed, vested interests..... Trow all this in a pot simmer for 20-30 years and you get the "lucky country". The crash couldn't come sooner!
ReplyDeleteGreat post!
Thanks
Zorro
This is really interesting. I came searching for more information on this topic having seen real house prices drop 10% over the last year and a half and all the mainstream economists claiming house prices were at an appropriate level due to the "supply/demand" problem in Australia and not to be concerned. From my research I completely believe we are in a bubble fuelled by an increase in leveraged debt which has forced house prices to an unsustainable level.
ReplyDeleteThis comment has been removed by a blog administrator.
ReplyDeleteGreat analysis but looks like you've missed the 50% capital gain of the last 4 years that has occurred in Sydney Melbourne.
ReplyDeleteHope you bought and didn't get sucked in by the doom and gloom merchants!